
Is the N2pc a correlate of attentional selection? An #EEGManyLabs multi-lab registered replication of Eimer (1996)
A multilab investigation into the N2pc as an indicator of attentional selectivity: Direct replication of Eimer (1996)
Abstract
Recommendation: posted 15 May 2025, validated 19 May 2025
Sherman, M. (2025) Is the N2pc a correlate of attentional selection? An #EEGManyLabs multi-lab registered replication of Eimer (1996). Peer Community in Registered Reports, 100998. https://doi.org/10.24072/pci.rr.100998
This is a stage 2 based on:
Martin Constant, Ananya Mandal, Dariusz Asanowicz, Motonori Yamaguchi, Helge Gillmeister, Dirk Kerzel, David Luque, Francesca Pesciarelli, Thorsten Fehr, Faisal Mushtaq, Yuri G. Pavlov, Heinrich R. Liesefeld
https://psyarxiv.com/3472y
Recommendation
- Advances in Cognitive Psychology
- Brain and Neuroscience Advances
- Collabra: Psychology
- Cortex
- F1000Research
- Imaging Neuroscience
- In&Vertebrates
- Journal for Reproducibility in Neuroscience
- Meta-Psychology
- Neuroimage: Reports
- Peer Community Journal
- Royal Society Open Science
- Studia Psychologica
- Swiss Psychology Open

The recommender in charge of the evaluation of the article and the reviewers declared that they have no conflict of interest (as defined in the code of conduct of PCI) with the authors or with the content of the article.
Evaluation round #1
DOI or URL of the report: https://doi.org/10.31234/osf.io/3472y_v2
Version of the report: 2
Author's Reply, 13 May 2025
Decision by Maxine Sherman , posted 14 Apr 2025, validated 15 Apr 2025
Dear Dr Constant and colleagues,
Thank you for submitting your Stage 2 report and sorry for the delay in getting back to you. I've now received two reviews back from the original reviewers and I've read your manuscript as well. I agree with both of the reviewers that your Stage 2 report is extremely impressive and stays true to the Stage 1 report. The exploratory analyses are valuable additions to the manuscript as well, particularly your analysis of other N2pc time windows used in previous work - together, it's a really thorough treatment of the N2pc that'll be a very valuable contribution to the literature and I was excited to see how the results came out.
As you will see, the reviewers have some very minor suggestions. Dr Hickey made an interesting point about what the N2pc reflects. If you do address this point in the manuscript, it would be best to do so in the discussion rather than the introduction, where in-principle acceptance has already been granted.
I look forward to receiving your revised submission.
Best wishes
Maxine
Reviewed by Reny Baykova , 14 Apr 2025
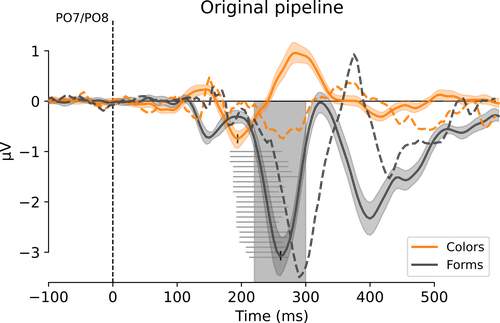
Constant et al. have replicated the second EEG experiment reported in Eimer (1996), which investigated the N2pc component of the visual event-related potential (ERP). The N2pc is commonly interpreted as a marker of attention, and the original study found that it can be elicited by different stimulus properties, namely shapes and colours. In addition, Eimer (1996) also found that the amplitude of the component was greater for shapes. Constant et al. conducted a replication of the original experiment as part of the EEGManyLabs project, and a total of 22 separate labs were involved in the replication. The N2pc effect using shapes was replicated, as well as the difference in amplitude between shapes and colours. The effect using colours was not replicated using the strict replication of the original pipeline and the ICA pipeline. It was, however, replicated using the collapsed localiser pipeline and in the additional exploratory analyses which didn’t use a fixed time window.
Overall, this is a very ambitious project that was conducted with great care. The study provides a valuable contribution to the literature on the N2pc and ERPs more generally. I commend the authors on the impressive amount of work they undertook with this project, and I have only a few minor comments.
1. Transparency and openness statement
I would suggest adding links to the data, analysis scripts and stage 1 report in the transparency and openness statement so that they are easier to find.
2. Tables containing Bays factors
Apologies if this is a common notation I’m not familiar with, but I found the notation “BF-0” initially confusing. I believe BF10 is the more commonly known notation, but if you prefer to go with BF-0 that’s completely fine, I’d just suggest adding a note to the tables to describe what it means.
3. Figure 17
Since each dot represents the average reaction time for each lab, I would suggest adding error bars to show the variability of the data (unless it all gets too messy).
In the description of the figure, I would suggest specifying that this shows reaction times on correct trials and trials kept after rejection.
4. Figure 18
Similar to my comments for Figure 17, if it isn’t too messy, it would be nice to add error bars, and describe what data was used in the figure description
5. Discussion
At the beginning of the discussion, you say that the colour manipulation is more influential because more studies use colour stimuli compared to shapes. Could you just provide some evidence to back this up?
Signed
Dr Reny Baykova
https://doi.org/10.24072/pci.rr.100998.rev11Reviewed by Clayton Hickey, 28 Mar 2025
The paper does exactly what was described in the pre-registration, plus a lot of additional exploratory analysis that is very interesting. The results are not trivial and provide new insight on a seminal paper in cognitive neuroscience.
I have some comments; all are minor.
P2 – ‘Furthermore, the N2pc might reflect engagement at the location of the relevant stimulus rather…’ This is a bit hard to distinguish from the preceding hypotheses and needs some clarification. That is, an account of the N2pc that posits target enhancement is an account of the N2pc as engagement at the location of the relevant stimulus, not the shift of attention proper. Similarly, an account that posits distractor suppression is an account as engagement, not the shift of attention.
The N2pc is commonly used and discussed as an ‘index of the deployment of attention’ or of ‘attentional shifting’. This is not incorrect, but perhaps misleading… the N2pc is (mostly) an indirect index of these constructs. It reflects the large-scale change in striate and extrastriate cortical activity that is the consequence of attention. This was a salient observation in the early papers from Luck, Eimer and others that has become somewhat lost. The first proposal of the N2pc as a reflection of a control mechanism emerged in MEG work from Max Hopf’s group, where the involvement of posterior parietal cortex in generating the mN2pc was tentatively interpreted as reflecting the mechanistic implementation of attention, rather than its consequence on sensory activity.
p. 35 – ‘…the belief in fixed component timing is still widely held.’ Needs some sort of support for the authors’ impression / intuition / belief. I don’t have this same impression… people have been looking at effects on component latency in visual search, and on N2pc latency specifically. There are papers cited in the MS that demonstrate that, like Brisson et al 2007. Other ‘early’ latency effect papers looking at search or N2pc that come to mind:
Smulders, Kok, Kenemans, Bashore (1995, Acta)
Wijers, Mulder & Mulder (1997, Psychopys)
Robitaille & Jolicoer, (2006, Neuroreport)
Kiesel, Miller, Jolicoeur, & Brisson (2008, Psychophys)
Hickey, van Zoest, & Theeuwes (2010, EBR)
More broadly, there were reports of P3 latency effects from Donchin and Kok in the ‘80s, probably the ‘70s too. I remember very early work from Falkenstein in the ‘90s with latency effects on Ne/ERN, either in the initial report or soon after. It could be more justifiable to say that the shift in N2pc timing observed here is larger than was expected across by the large group of authors contributing to this paper.
Spelling etc:
p. 8 – ‘This copy was high-pass filtered at 2 Hz (passband edge)…’ for completeness, it would be good to have the same level of detail as for other filter descriptions.
p. 9 – ‘…that is, ERP amplitude at electrodes P07/9 are lower…’ to ‘…are more negative…’
p. 36 – The brightness of monitors has broadly increased over the last 40 years, and this could have something to do with the difference between the original report and these replications. CRT monitors were pretty dim by default, and and if you increased brightness the monitors degraded and became dimmer over time. If it was an early LED panel – unlikely as no one used them for vision research – then it’s even more probable, as the original fluorescent backlights were awful.
signed, Clayton Hickey
https://doi.org/10.24072/pci.rr.100998.rev12


